الأحد، 10 يناير 2016
الأربعاء، 6 يناير 2016
الأحد، 3 يناير 2016
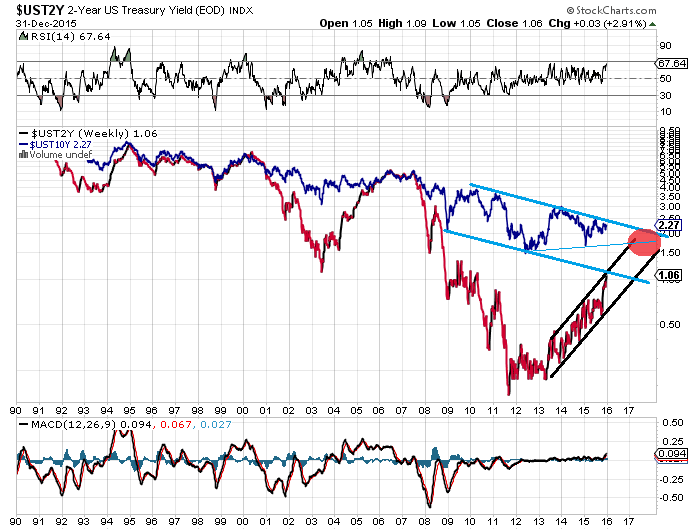
SPX around 2500 by year-end? Yield curve chart points towards 2017 for an equities top
Yield curve (Yield curve wiki) is broadly perceived as a leading economic indicator.Specifically an inverted/flat curve has signaled many times since 1970 a market top and a subsequent recession
The above chart shows the difference between 10-year yield and 2-year yield.A zero or negative reading means a flat or inverted yield curve respectively.During 2000 top and near 2007 top of equities market the difference was zero to negative, signaling a market top.
As we can see from the above chart, 2-year yield is in a steep rising channel, when 10-year yield is in a descending channel.A projection of these two channels shows a convergence of them (a.k.a a flattened yield curve, a.k.a an equities market top) in 2017.
Will 2016 be another painful year for bears or this time will be different?
الجمعة، 1 يناير 2016
الجمعة، 11 ديسمبر 2015
Natural Gas:Winter 2016 will be hot and the Bears awake
In a previous post we predicted correctly that Natural Gas will return to 1.95(Nat Gas is returning to where it started (1.95$)).Now we present our long term view on NG for 2016.
We believe that NG will soon bounce towards 2.25-2.5 (02/2016) and then dive towards 1.35-1.45 (4Q2016).
As we showed in previous posts (2016: The Year of the Bear (II))(DAX: A Huge Head and Shoulders pattern is already forming), winter 2016 is going to be "hot" and the Bears awake
الأربعاء، 9 ديسمبر 2015
DAX: A Huge Head and Shoulders pattern is already forming
We believe that 2016 will be a Bear Year for equities in general(2016: The Year of the Bear (II)).Specifically for DAX we believe that it will move down towards 9000(H&S neckline) then move towards 10.400(Right Shoulder) and finally move towards around 6800 on 4Q2016. We predict that this correction will move DAX price aprox 45% lower from March-April 2015 Highs.
السبت، 5 ديسمبر 2015
2016: The Year of the Bear (II)
In a previous post(SPX year-end prediction: 2016 the Year of the Bear) we presented our prediction regarding SPX for 2016. Today we present a very long term chart of SPX which further enhances our view:
Another relevant chart for Dow Jones Industrial:
And for a more clear picture of the currently forming H&S, let us see the DJ small cap index:
الثلاثاء، 1 ديسمبر 2015
SPX year-end prediction: 2016 the Year of the Bear
As 2016 approaches we present today our year end SPX prediction for 2016.
We believe that SPX has topped out (or almost there) and that a bear market in equities will ensue.We expect this bear market to bring SPX down to 1400 0r even around 1000 in late 2016 - early 2017.
(needless to say that SPX will not move in a straight line down to 1400/1000.The arrows show the general trend)
الأربعاء، 25 نوفمبر 2015
Gold's bottom on summer 2016
Gold remains in a well establish bear market since early 2013. Looking at the big picture we believe that currently Gold is running the C leg of an ABC correction that started back in 2012.Specifically gold will probably soon complete the 3rd wave of C and then bounce temporarily before a final leg (5th wave of C) and a bottom at green zone at around 930$ during the 2Q or 3Q of 2016
We believe that gold will bottom out on summer 2016 along with other major commodities and then a strong upleg will ensue.Hopefully this upleg will not coincide with WW3...
الأربعاء، 4 نوفمبر 2015
Energy stocks (XLE) about to bounce and head south
Energy stocks (XLE) recently showed some strength.Since its lows around 59-60$ (as we correctly predicted on early August Oil at crossroads ) on late August and and late September XLE is moving north. Currently XLE is approaching multiple resistance lines.
If we zoom out a bit and focus on the big picture we believe that XLE will move again towards its lows or even lower, finally reaching a bottom around 55$ on summer 2016.
الاشتراك في:
الرسائل (Atom)