A textbook Head and Shoulders pattern with volume confirmation in Emerging markets local debt fund (ELD) suggests significant further strength for USD versus EM currencies (especially NE Asian currencies) and possibly further weakness for EM markets like EWM(Malaysia), EWS(Singapore), IDX(Indonesia)
إظهار الرسائل ذات التسميات Head and Shoulders. إظهار كافة الرسائل
الأحد، 1 فبراير 2015
Further USD strengthening versus EM currencies?
A textbook Head and Shoulders pattern with volume confirmation in Emerging markets local debt fund (ELD) suggests significant further strength for USD versus EM currencies (especially NE Asian currencies) and possibly further weakness for EM markets like EWM(Malaysia), EWS(Singapore), IDX(Indonesia)
السبت، 9 أغسطس 2014
Gold Update.Its time for decisions....
Gold after completing an Inverse Head and Shoulders (blue chevrons) pattern (or a double bottom) is now moving along a descending resistance trendline from late 2012.
We believe that Gold is about to break up that trendline and begin a substantial move up toward 1380 and then 1430, for the following reasons:
1.During the last downturn in late May RSI14(weekly) managed to stay above 40 (green circle)
2.Bollinger Band width is extremely low (6,4).Every time, the last ten years, BB width was that low, it marked the beginning of a substantial move up.
We are about to find out soon...
We believe that Gold is about to break up that trendline and begin a substantial move up toward 1380 and then 1430, for the following reasons:
1.During the last downturn in late May RSI14(weekly) managed to stay above 40 (green circle)
2.Bollinger Band width is extremely low (6,4).Every time, the last ten years, BB width was that low, it marked the beginning of a substantial move up.
We are about to find out soon...
الأربعاء، 2 يوليو 2014
SPX ready to correct and form a Left shoulder?
Yesterday SPX almost touched our target of 1980 (http://goldenopportunitytrading.blogspot.co.uk/2014/03/a-deja-vu-for-spx.html). SPX is getting overbought at daily and weekly timeframes (RSI>70) with negative divergence especially in daily RSI.
VIX probably is forming a diamond reversal pattern, which means increased volatility for the next days-weeks, consistent with a deep correction.
We believe that SPX is almost ready for a substantial correction towards bellow 200 EMA(weekly) around 1750.
If this scenario finally plays out, 1980 will probably be the left shoulder of a huge Head and shoulders pattern for SPX.
الثلاثاء، 1 يوليو 2014
2 scenarios for Agricultural commodities (DBA)
Agricultural commodities ETF (DBA) price is confined within a descending triangle from 2008.There is an approximately 3 year cycle from top to top and from bottom to bottom.If this pattern continues then the price may hit its final bottom at 24$ in mid 2016. (Bearish scenario).However if DBA manages to stay above 26$ and break the descending resistance line from 2008 it may then complete an inverted head and shoulders pattern and break out of the triangle towards 34$ (bullish scenario)
Bearish Scenario
Bullish Scenario
Bearish Scenario
Bullish Scenario
السبت، 7 يونيو 2014
Gold update: IHS about to fail?
Gold after forming a triangle in April and May broke down.Now is moving towards 1265$ although with low volume. In order for the bulls to remain valid the IHS scenario they need to see higher volumes. The April May triangle is probably a continuation pattern and it gives a target for gold at 1200$ where it should bounce.
So a possible pathway for gold:
Probably gold is now forming a falling wedge and should bottom in mid July(cycle low) at ~1200$
If this scenario plays out then Gold is in a long term trading zone between 1200 and 1400$
Gold Miners (GDX) are following a similar pattern. GDX is moving (with declining volume) towards 23 ( gap from 27/5) and then move towards 20,5 in early July (it will bottom earlier than gold just like December 2013).
.png)
So a possible pathway for gold:
Probably gold is now forming a falling wedge and should bottom in mid July(cycle low) at ~1200$
If this scenario plays out then Gold is in a long term trading zone between 1200 and 1400$
Gold Miners (GDX) are following a similar pattern. GDX is moving (with declining volume) towards 23 ( gap from 27/5) and then move towards 20,5 in early July (it will bottom earlier than gold just like December 2013).
.png)
الأربعاء، 26 مارس 2014
الاثنين، 24 مارس 2014
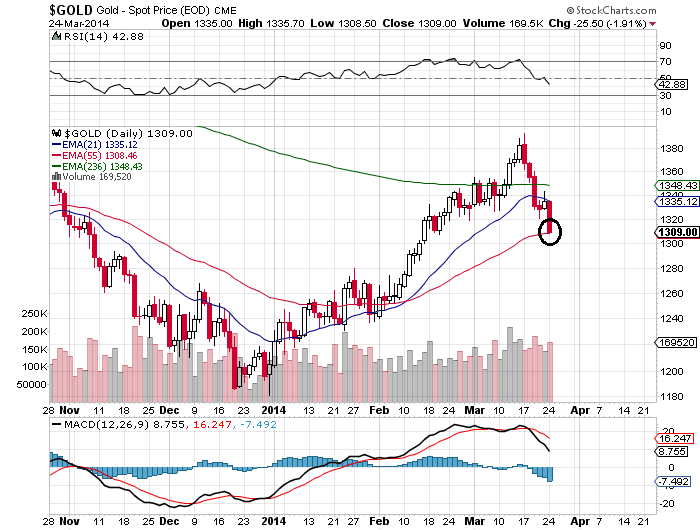
GOLD DAILY-GDX DAILY
Gold did break the trendline from Dec2013 today(and stopped exactly at 55 days exp moving average) and now is moving towards 1285$ where it will probably reverse.As it turns out, in Friday we gold did not managed to make a golden cross as we noticed(http://goldenopportunitytrading.blogspot.co.uk/2014/03/golden-cross-or-not.html)
GDX also broke its respective trendline earlier than gold and is now moving towards 23,20$ where it should bounce and reverse, forming the right shoulder of an Inverted Head and Shoulder pattern(IHS).
Then probably will move towards 30,45$ and then 34,90$
GDX also broke its respective trendline earlier than gold and is now moving towards 23,20$ where it should bounce and reverse, forming the right shoulder of an Inverted Head and Shoulder pattern(IHS).
Then probably will move towards 30,45$ and then 34,90$
السبت، 22 مارس 2014
A POSSIBLE PATHWAY FOR GOLD
Zooming in a previous chart of gold(http://goldenopportunitytrading.blogspot.co.uk/2014/03/weekly-gold.html).
If gold breaks the trendline from Dec2013 on Monday,next stop will probably be 1285$(50% retracement of the upmove from Dec2013) .
Assuming that resistance at 1285 holds, then a right shoulder of an Inverted Head and Shoulders pattern will be formed.
From there next target will be 1453$ and then 1555$
If gold breaks the trendline from Dec2013 on Monday,next stop will probably be 1285$(50% retracement of the upmove from Dec2013) .
Assuming that resistance at 1285 holds, then a right shoulder of an Inverted Head and Shoulders pattern will be formed.
From there next target will be 1453$ and then 1555$
الثلاثاء، 18 مارس 2014
GDX Weekly
GDX Weekly
Price between EMA 21 and EMA 55
Testing EMA 55 resistance @ 28,11$
Resistance zone : 28$(EMA55)-30,45$
Possible pathways:
a) GDX breaks EMA55 and tests Resistance @30,45$ (Neckline) then corrects
b)GDX Rejects EMA55 and corrects
Correction Targets: Between fibo 61,8%-76,4% i.e GDX @22,5 $-24,5 $
In that case there will be an Inverted Head & Shoulders pattern (IHS) with the right shoulder at ~22,5-24,5 $ projecting @ 40 $ (30% upside potential)
So , possible Buy zone @ 22,5-24,5 $
with Target @ 35-40 $
Stop Loss @ 19,80 $
Price between EMA 21 and EMA 55
Testing EMA 55 resistance @ 28,11$
Resistance zone : 28$(EMA55)-30,45$
Possible pathways:
a) GDX breaks EMA55 and tests Resistance @30,45$ (Neckline) then corrects
b)GDX Rejects EMA55 and corrects
Correction Targets: Between fibo 61,8%-76,4% i.e GDX @22,5 $-24,5 $
In that case there will be an Inverted Head & Shoulders pattern (IHS) with the right shoulder at ~22,5-24,5 $ projecting @ 40 $ (30% upside potential)
So , possible Buy zone @ 22,5-24,5 $
with Target @ 35-40 $
Stop Loss @ 19,80 $
الاشتراك في:
الرسائل (Atom)


.png)
.png)
.png)