الثلاثاء، 31 مارس 2015

Gold Miners: A possible EW count suggesting major break down

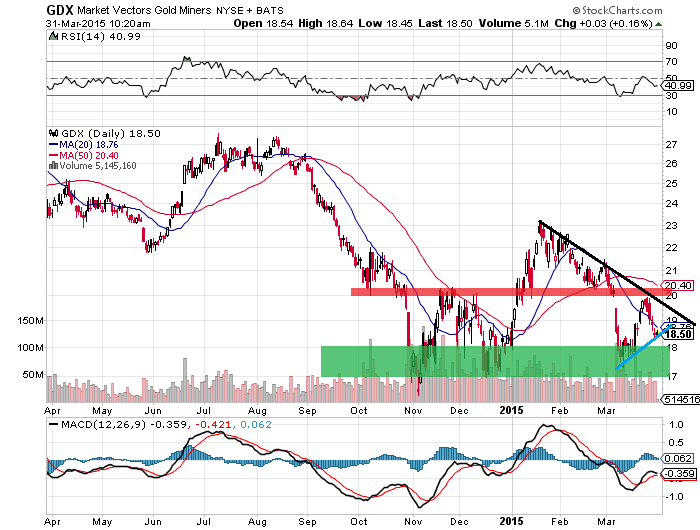
As we noted in a previous post(Gold and Miners:A temporary bounce?) Gold and Gold Miners (GDX) bounced at resistance zone of 1200-1210 and 20-20,5 respectively.They are moving now downwards possibly towards their support zones at 1140-1150 and 17-18 respectively.

A possible GDX Elliot Wave count suggests a break down of support zone and a move towards 7,5-10$.

A scenario like the above is in accordance with our old view(March 2014)(A deja vu for SPX ?) that major equity index- SP500 will top at around 2000 and then slide to a new bear market.
et tempora quidem ante erit difficile...

الثلاثاء، 24 مارس 2015

Gold and Miners:A temporary bounce?

Gold bounced hard at 1140$ and is moving higher.Now it is just under a resistance zone at 1200-1205$ where probably will not penetrate and move lower, maybe to test again 1140 level.

Same picture for miners (GDX) ETF. It bounced at the extremely important support of 17-18 (Will Gold miners form a triangle?) and is now just below a resistance zone at 20-20,5$.It also filled the gap of early March(blue circle).We believe that GDX at current levels or a bit higher will bounce and move lower again.

To summarize, we lean bearish towards Gold for the following days-weeks    

الثلاثاء، 10 مارس 2015

Will Gold miners form a triangle?

Gold Miners (HUI)
HUI is since 2012 in a clear downtrend.Recently has bounced once at a very significant support zone at 150-160(green area).

Currently HUI is confined between two descending resistance trendlines (black stronger, blue weaker) and the support zone at 150-160.

We believe that HUI will probably bounce at 150-160 and then move towards the weaker resistance trendline(blue)
A possible scenario could be the following:


الاثنين، 2 مارس 2015

Treasuries and HY bonds near a top?

US Bonds in general (except TIPs and HYG) are in a well defined uptrend.
However TLT(20+ Year Treasury Bond Fund ETF) has recently hit the upper line of a longterm channel  with an RSI reading of over 80.The last 2 times that a similar situation took place, a major top for TLT ensued.Probably we are at or near a top for TLT. We believe that TLT will move towards the middle channel line where it will probably bounce and maybe retest the recent 138 high.
Regarding TIP(Inflation Protected Bond Fund ETF) it is currently in a trading range between 112 and 116.There is a small possibility for an inverted H&S formation similar to that of 2013 which can push TIP higher.However TIP is still in a downtrend since 2013.If TIP will breakdown below 111 then there is a good possibility for the following scenario
and last but not least, HYG(High Yield Corporate Bond Fund ETF) which is currently near strong overhead resistance at 92.Currently HYG is in a megaphone formation just below the upper line.There is a good possibility for a bounce and reverse of HYG at 92.Will it signal a major top for equities?


الخميس، 26 فبراير 2015

Gold and Silver ready for a bounce?

Gold is probably ready to bounce from current levels towards 1240-1255.Daily RSI is currently at around 40 providing a support level from which gold can bounce towards RSI 60.For the following days we believe that gold will move in a trading range between 1190-1255$

Same picture for Silver.Probably it will move between 15,75-17,75$

الأربعاء، 11 فبراير 2015

Gold turning bearish again?

Gold fell below 1235-1245 support zone(now resistance).Last hope for bulls the ascending trendline from November 2014 and the weekly RSI support zone of 40-45.


الأحد، 1 فبراير 2015

Further USD strengthening versus EM currencies?


A textbook Head and Shoulders pattern with volume confirmation in Emerging markets local debt fund (ELD) suggests significant further strength for USD versus EM currencies (especially NE Asian currencies) and possibly further weakness for EM markets like EWM(Malaysia), EWS(Singapore), IDX(Indonesia)


الثلاثاء، 27 يناير 2015

Gold in uptrend(?), Silver and miners still in downtrend

Gold managed to penetrate the heavy resistance line from 2012 and EMA(weekly) 21 and 55 which is bullish.However RSI14(weekly) bounced at resistance area 60-65(red line).

Silver and miners(GDX) are still below their heavy resistance trendlines from 2012 and EMA55(weekly) respectively.


Will Gold drag Silver and GDX or vice versa?

We believe that the level of 1235-1240$ is very important for gold.Bulls need to see price of gold above that level and preferably RSI14(weekly) breaking above its respective resistance area of 60-65(usually that happens during a 3,III).If Gold moves below that level the bullish scenario is loosing steam...

الأحد، 18 يناير 2015

Gold turning bullish?

Gold finally managed to breakup the significant resistance line from 2012 with heavy volume after forming an IHS.Currently price of gold is above 21 and 55 EMA.
Next target 1340$.